Throughput Graph
This has been noticed that the throughput graph is always less attentive. The reason could be that a performance tester does not understand its importance or does not care about it because it is not…
In a performance test script, a transaction refers to a group of requests which are sent to the server. A simple webpage may contain multiple requests which are associated with the components available on it.…
Response time graph gives a clear picture of overall time including requesting a page, processing the data and getting the response back to the client. As per PTLC (Performance Test Life Cycle), the Response time…
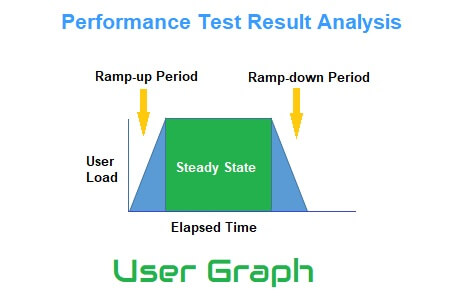
A User Graph provides complete information about the load patterns during the test. This graph helps to identify: In the runtime viewer, User Graph provides information about the number of users currently accessing the application. When…
Client-side performance test statistics represent the behaviour of the application which an end-user may experience in the real world. The analysis of such stats and graphs is termed Client-side Result Analysis. As an outcome of…
Moving to the next level named as Intermediate level of performance test result analysis; you will learn how to read the different types of graphs. In the previous post, you got a high-level knowledge of…